
Q1 2025 Executive Summary
Lightning Docs is a B2B SaaS platform founded by the partners at Geraci LLP, the nation’s largest private lending law firm. The platform was originally designed to streamline the law firm’s drafting of business purpose mortgage loan documents and is now used by more than 50% of the top 50 private lenders nationally, including 6 of the current top 10.
The first quarter of 2025 is officially in the books, and private lending is showing no signs of slowing down. In fact, March set new record highs for both bridge and DSCR loan volume on Lightning Docs. At this point, it’s clear that private lending has not experienced the typical slowdown seen at the start of previous years.
However, a cautionary tale is also merited here. Upon reviewing data aggregator Forecasa’s statistics and tracking the year-over-year progress of the top 100 national private lenders, 51 of the leading lenders either decreased or were exactly flat when comparing Q1 2025 to Q1 2024. When purely looking at file counts of the top 100 lenders they increased their volumes by 6% during this time period.
With continued volatility in the markets, it’s more important than ever for private lenders to keep an eye on rate movements and market signals. What is interesting is that despite significant volatility in equity and debt markets, secondary markets for private lenders have remained robust, and if this trend holds, we can expect volumes to remain strong in the months ahead.
As always, we’ve broken down the data to highlight the key trends shaping the market and how they could impact your business moving forward.
Bridge Loan Volume
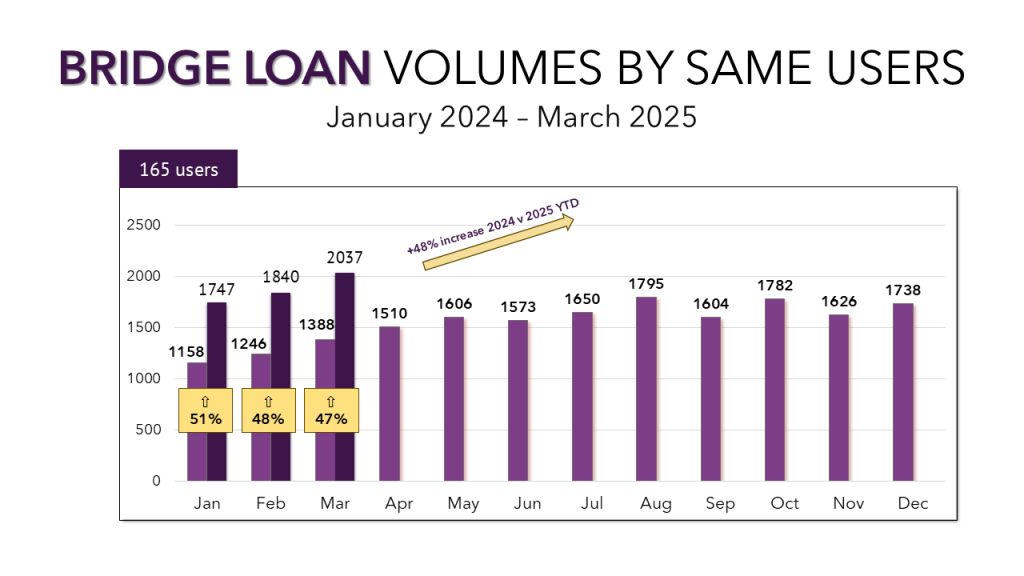
March 2025 represented an all-time high for bridge loan transactions written in Lightning Docs for a total of 2,458 bridge loans, surpassing the previous record set in February of this year of 2,154 loans. When tracking the same 165 users who signed up to use the system on or before January 1, 2024, we see a 48% year-over-year increase comparing volumes from 2025 to 2024.
DSCR Loan Volume
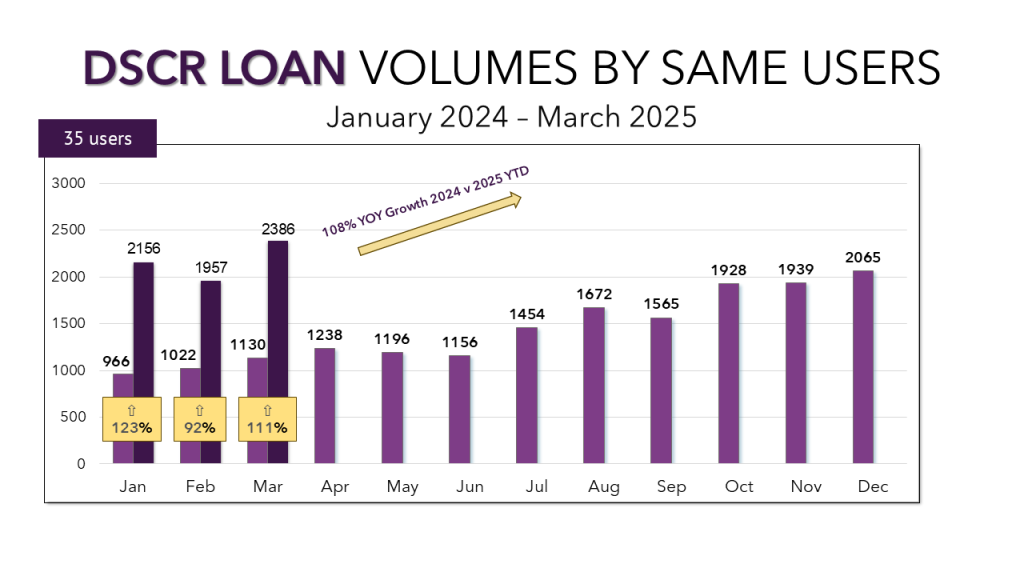
DSCR loans also hit a new high in March with 2,483 loans in the system from the entire user base. When tracking the same 35 users who started using the system on or before January 1, 2024, DSCR volume was up an astonishing 108% year over year.
Bridge Interest Rates and Average Loan Amounts
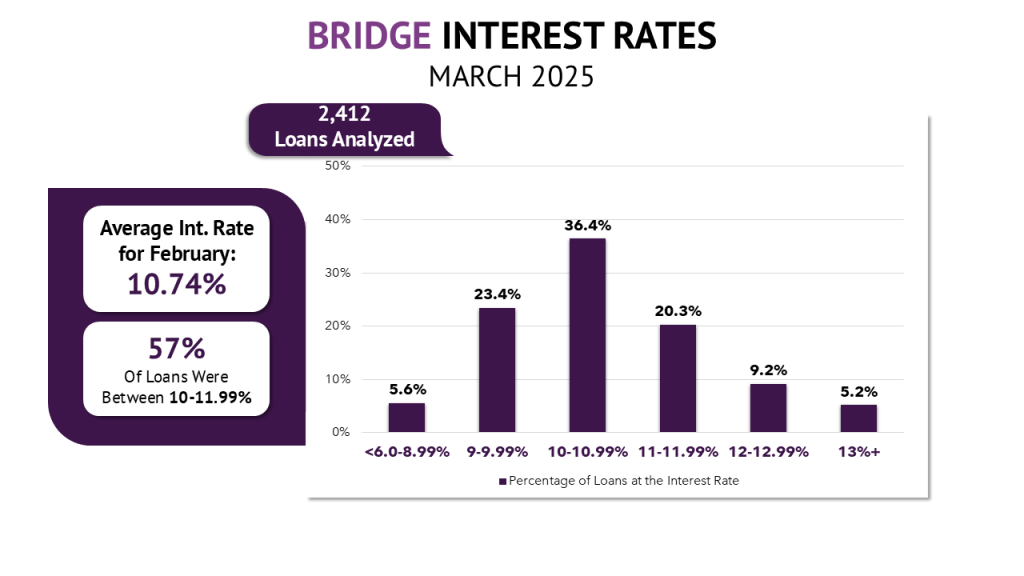
Bridge loan rates dipped slightly in March from 10.77% to 10.74%, continuing a year-long trend of gradual declines. This is the tenth drop in the last eleven months. Median rates held steady at 10.50%, remaining a quarter point below the average. Rate distribution was consistent, with 36.4% of loans falling between 10.00% and 10.99%, and near-equal distribution in the adjacent ranges one percentage point above and below.
Average loan amounts rose by $15,000 to $659,736, reaching their highest level since December. However, the median loan amount declined, suggesting a market dynamic where a few large loans are driving up the average. This mix points to a healthy balance: while lenders are capitalizing on large opportunities, most loan activity remains concentrated in accessible mid-range deals.

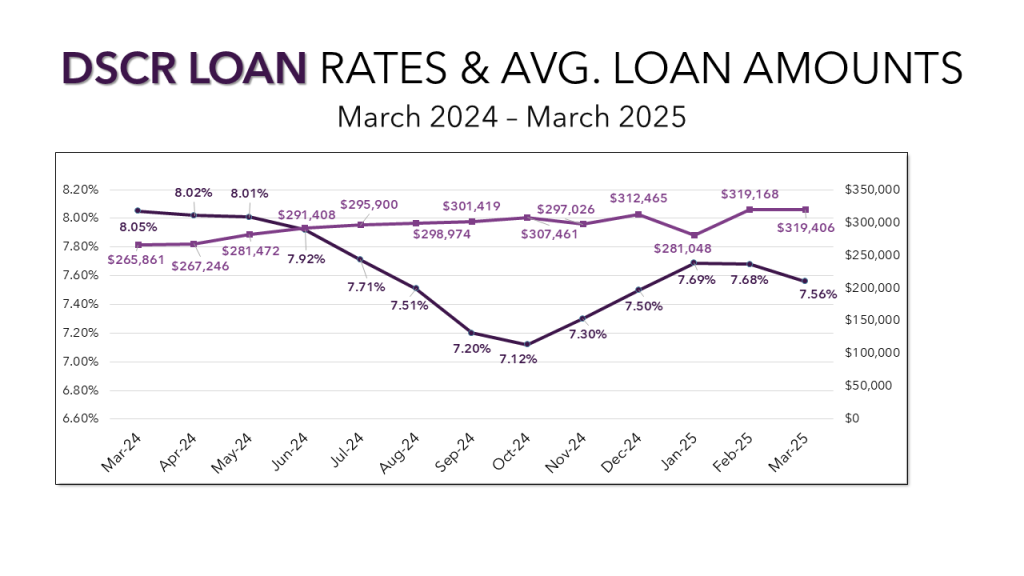
DSCR Interest Rates and Average Loan Amounts
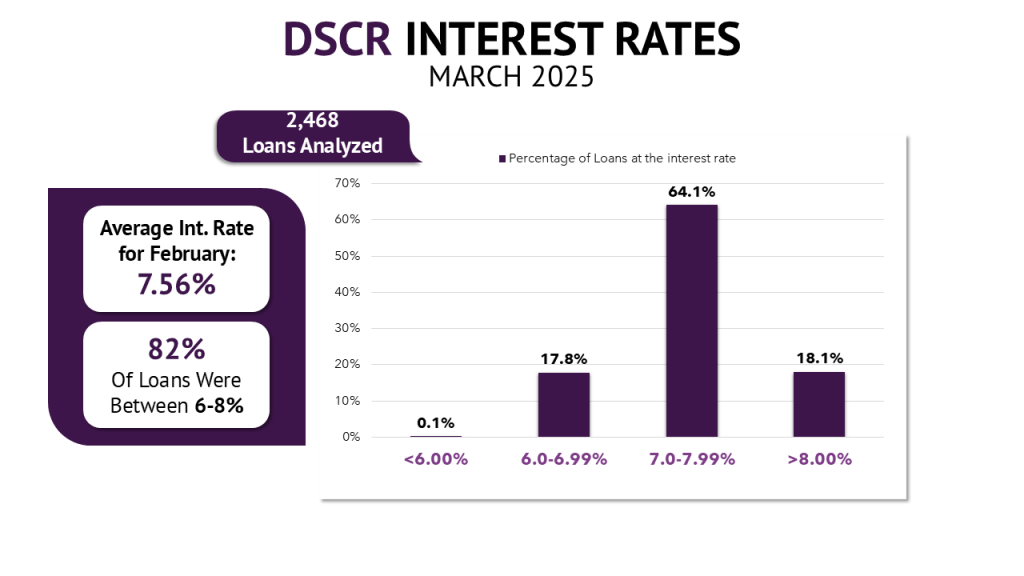
DSCR rates fell 12 basis points to 7.56%, nearly returning to the levels seen at the end of 2024 after a spike earlier this year. Average loan amounts remain the highest of the past 12 months, holding steady just above $319,000.
While 64% of loans are still priced between 7.00% and 7.99%, we’re seeing a clear shift toward lower rates. The share of DSCR loans in the 6.00% to 6.99% range jumped from 10.8% in February to 17.8% in March.
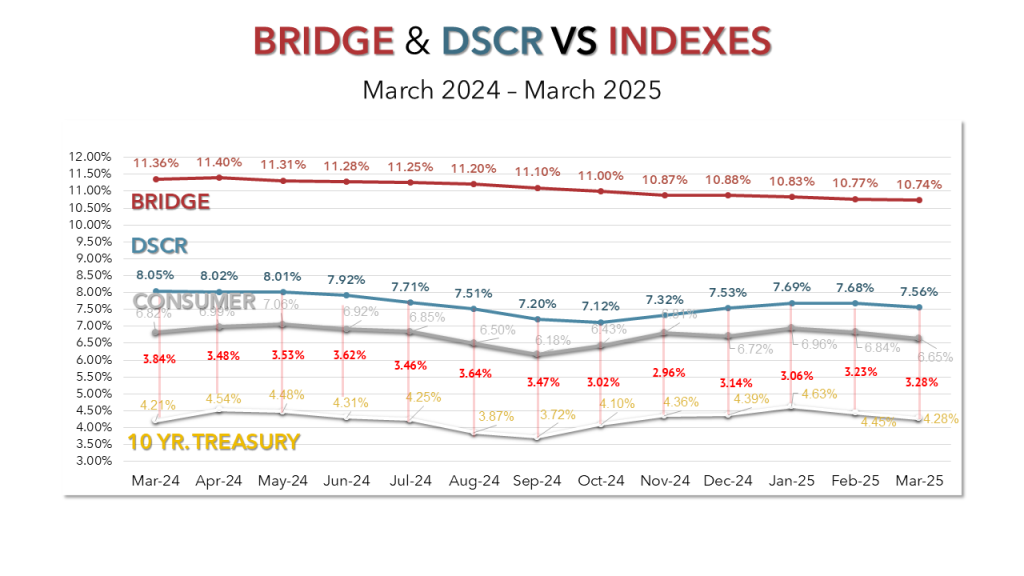
Spreads
The 10-year treasury yield fell by 17 basis points in March. DSCR loans and consumer mortgage rates followed suit, decreasing by 12 and 19 basis points, respectively. As a result, the spread between DSCR loans and the 10-year treasury widened to 3.28% as the debt markets are requiring higher yield due to volatility.
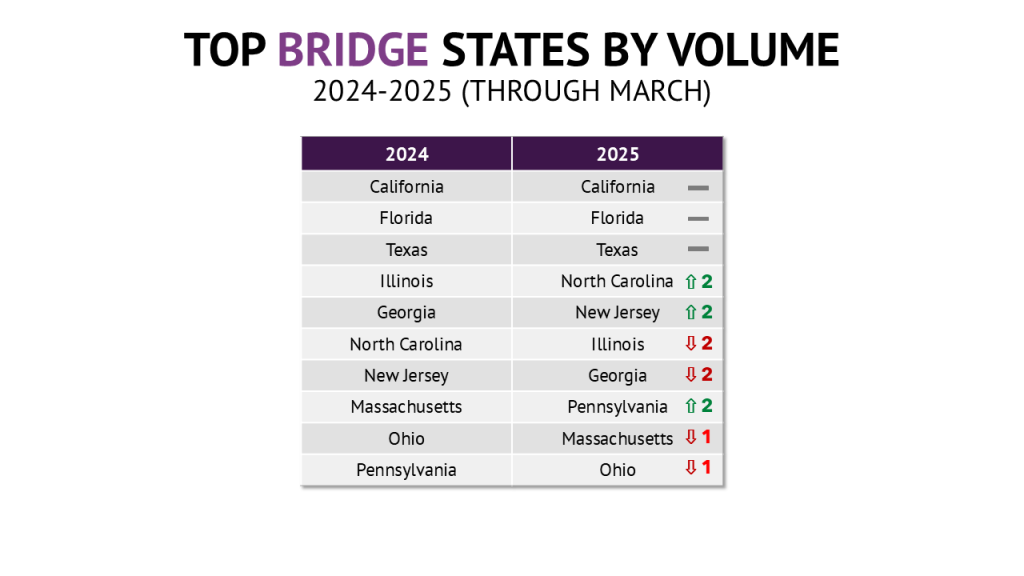
Top Bridge States
The top 10 states for bridge loans remained consistent with 2024. California, Florida, and Texas still lead, while North Carolina, New Jersey, and Pennsylvania have climbed the ranks.
Notably, nine of the top 10 states are also among the 11 most populous, highlighting the correlation between population and bridge loan demand. The one exception is New York, which remains a complex market due to its regulatory environment. To address this, Lightning Docs recently launched CEMA and Building Loan Agreements.
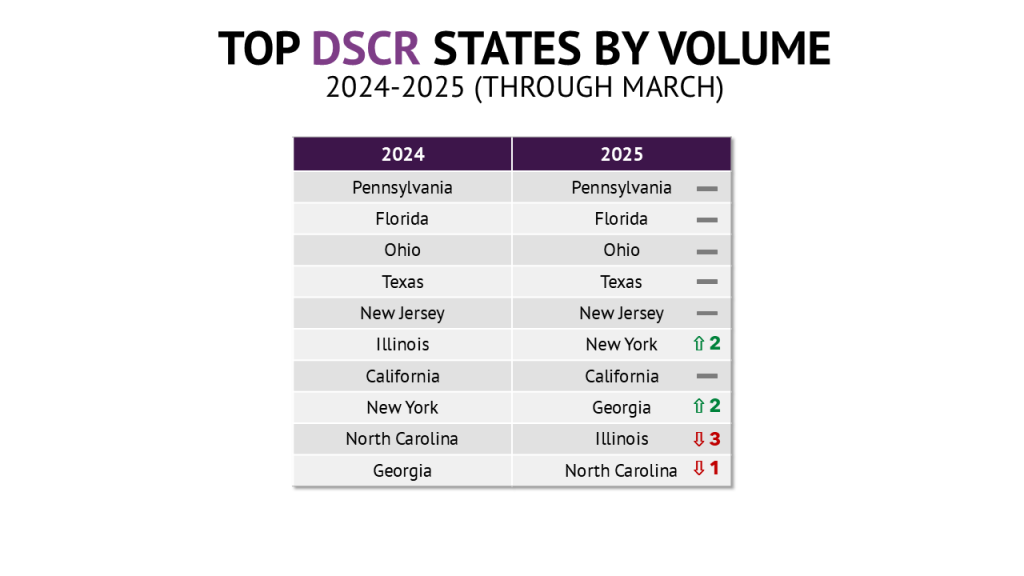
Top DSCR States
The top DSCR states have returned to their usual order after a full quarter of data: Pennsylvania, Florida, Ohio, Texas, and New Jersey make up the top five, matching their 2024 standings.
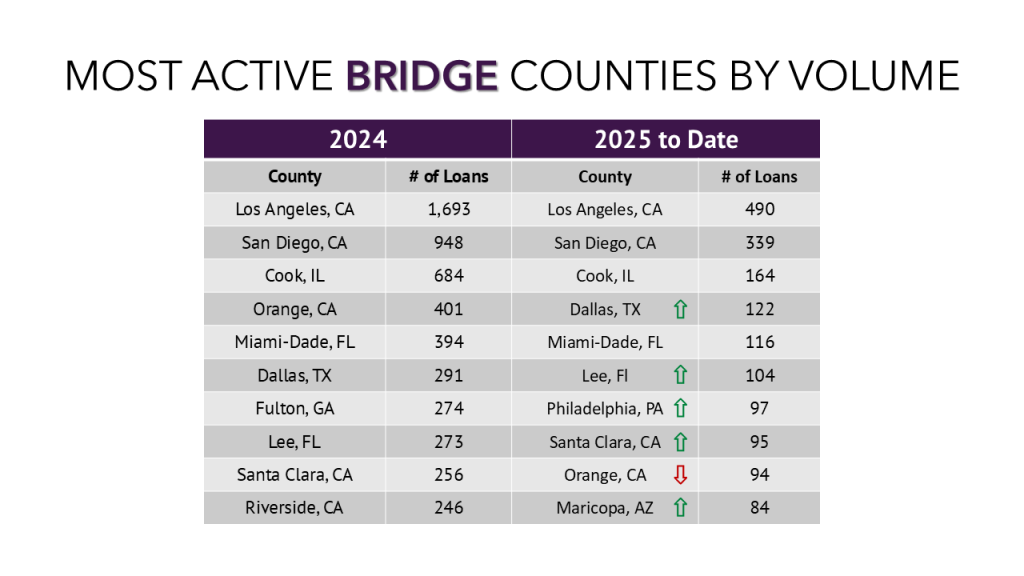
Top Bridge Counties
Similarly, the top three counties for bridge loans stayed consistent with Los Angeles, CA, San Diego, CA and Cook, IL leading the way. Philadelphia, PA surged into the top 10 in March and Maricopa, AZ held on to the 10th spot as the only other new entrant to the list.
It’s worth noting just how dominant the Los Angeles market has been. With 489 bridge loans in Q1, it has 150 more than second place market San Diego and nearly three times that of third place Cook, all while maintaining average loan amounts above $1 Million.
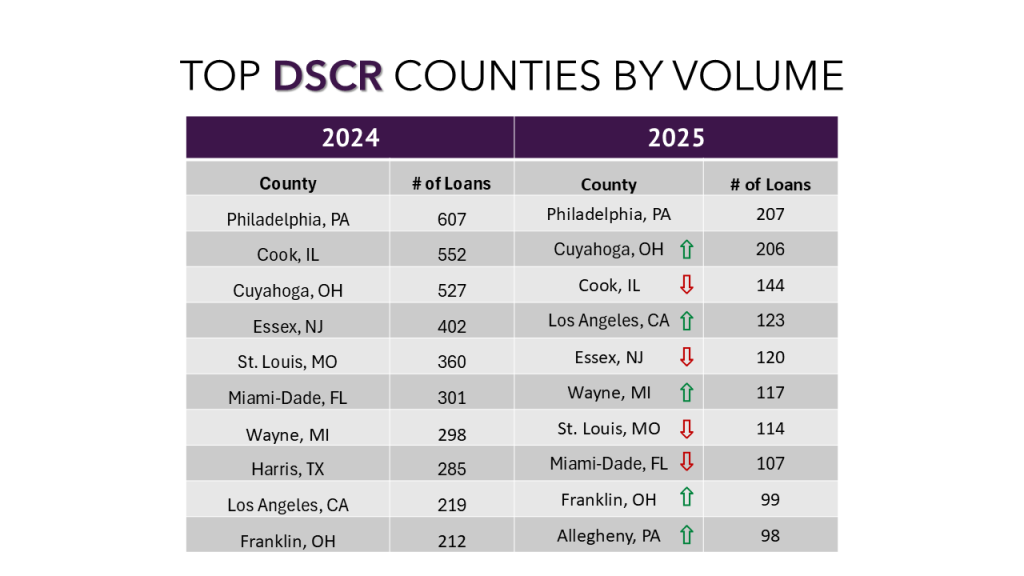
Top DSCR Counties
When looking at the top counties for DSCR loans, it becomes clear why we see Pennsylvania and Ohio near the top of the states’ list, each having two counties in the top 10. Philadelphia, PA, Cuyahoga, OH, and Cook, IL make up the top 3 spots.
Los Angeles, Cook, Miami-Dade, and Philadelphia counties stand out as attractive markets for any lender, appearing on both the bridge and DSCR top 10 lists.
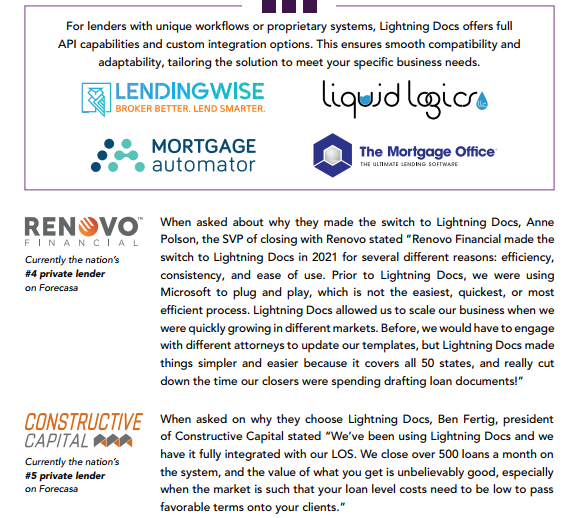
Seamless Integrations
Lightning Docs continues to be the platform of choice for private lenders looking to streamline operations, reduce costs, and scale efficiently. Our integrations with leading Loan Origination Software (LOS) platforms and full API capabilities eliminate manual entry, reduce errors, and allow for custom workflows.
Parting Thoughts
Lenders are often focused on managing macro-economic risks which are outside of their control. What the data shows is that 50% of the top private lenders volume decreased or remained flat while the other 50% grew. Both groups existed in the exact same macro-economic environment.
Lenders are well served by focusing on better execution in their businesses, including streamlining processes. From my vantage point as the CEO of Lightning Docs, we are consistently seeing our users outperform their peers by wide margins. The reasoning is easy to appreciate: lenders who are focused on building strong foundations to scale from will continue to dominate in uncertain environments.