
April certainly wasn’t a typical month. Looming tariffs raised questions about how the broader economy would respond, and early in the month, when the reciprocal tariff strategy was announced, the stock market reacted with sharp volatility. More relevant to private lending was what followed in the bond market. As bond prices rose by nearly 50 bps in just a week, uncertainty rippled through our industry and the economy as a whole. If bonds stayed on this trajectory, were we heading toward an imminent recession? With those doubts top of mind, transactions briefly slowed.
Fortunately, the uncertainty didn’t last long. The bond shock prompted a swift change in course from the Trump administration just one week later, helping to steady the course. If you caught AAPL’s State of the Industry last month, my guest Ben Fertig of Constructive Capital predicted exactly this, that the bond market would steer economic decision-making.
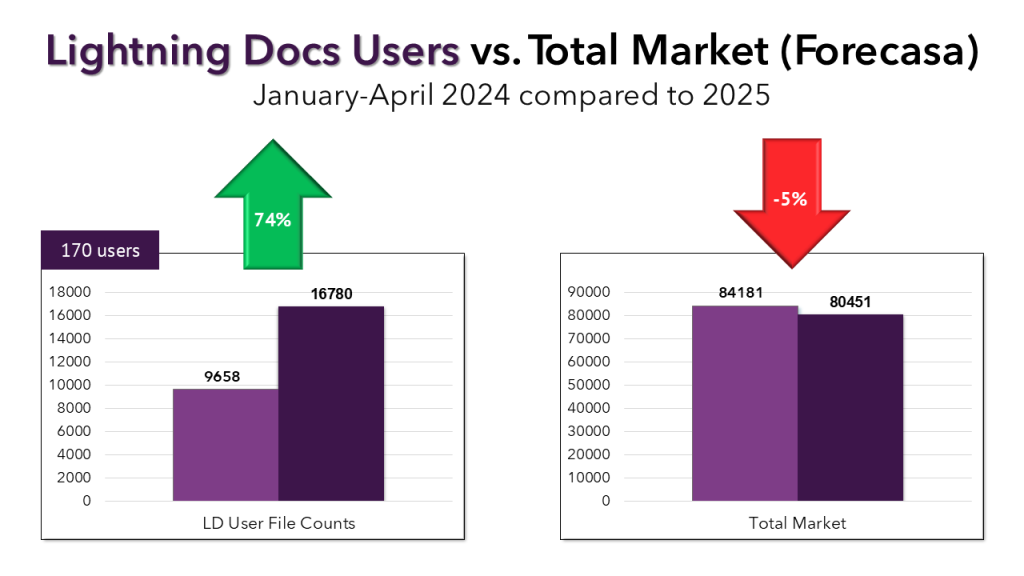
Despite the turbulence and continued macro uncertainty, private lenders using Lightning Docs continued to thrive in April. Our platform reached new record highs for both short-term bridge loans and long-term DSCR loans, reinforcing the critical role automation plays in today’s lending environment.
Looking at the broader market, Forecasa reports that total private loan transactions are down 5% year over year through April. In contrast, the 170 Lightning Docs users active since January 1, 2024, have increased their total transactions by 74% over the same period.
So, what’s driving that growth? Let’s dive into the numbers behind it: interest rate trends, average loan amounts, and the markets leading the way in April.
Bridge Loan Volume
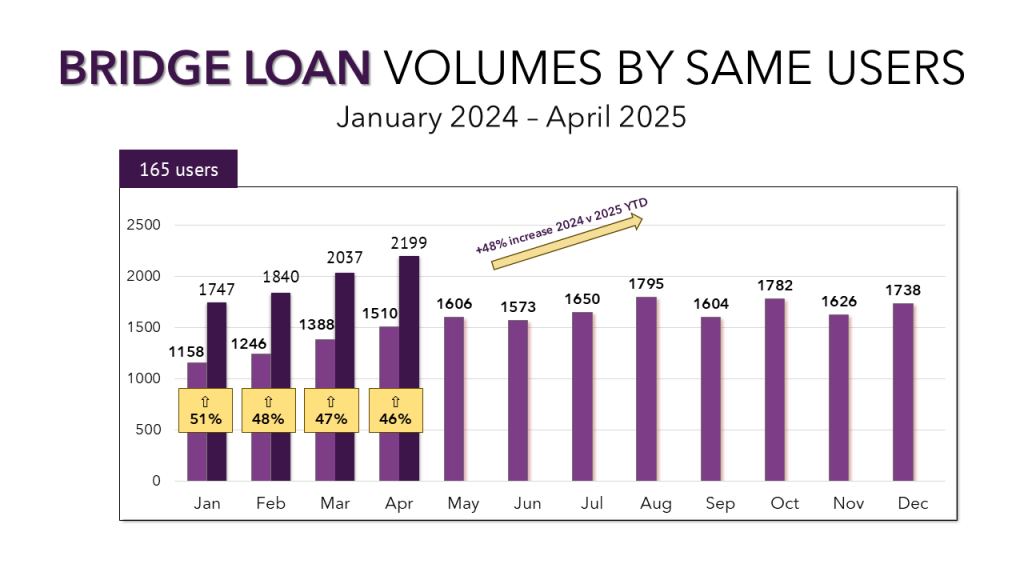
April 2025 was once again an all-time high for bridge loan transactions written in Lightning Docs for a total of 2,634 loans, making this the fifth month in a row that has set a new high. When tracking the same 165 users who signed up to use the system on or before January 1, 2024, we see a 48% YOY increase comparing volumes from 2025 to 2024.
DSCR Loan Volume
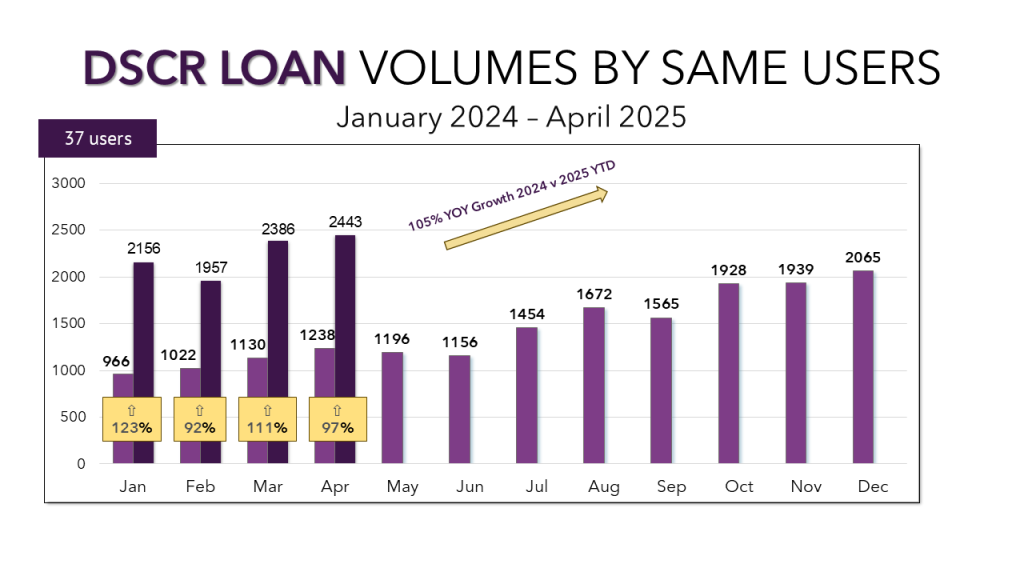
While growth for bridge loans has been impressive, the increase in transactions for DSCR loans remains the standout. DSCR loan volume once again set records in April with 2,504 loans in the system from the entire user base. When looking at the same 37 users who started using the system on or before January 1, 2024, DSCR volume was up a staggering 105% YOY. I will keep screaming from the rooftops, bridge lenders MUST investigate expanding their offerings into DSCR if they have not already done so.
Bridge Interest Rates and Average Loan Amounts
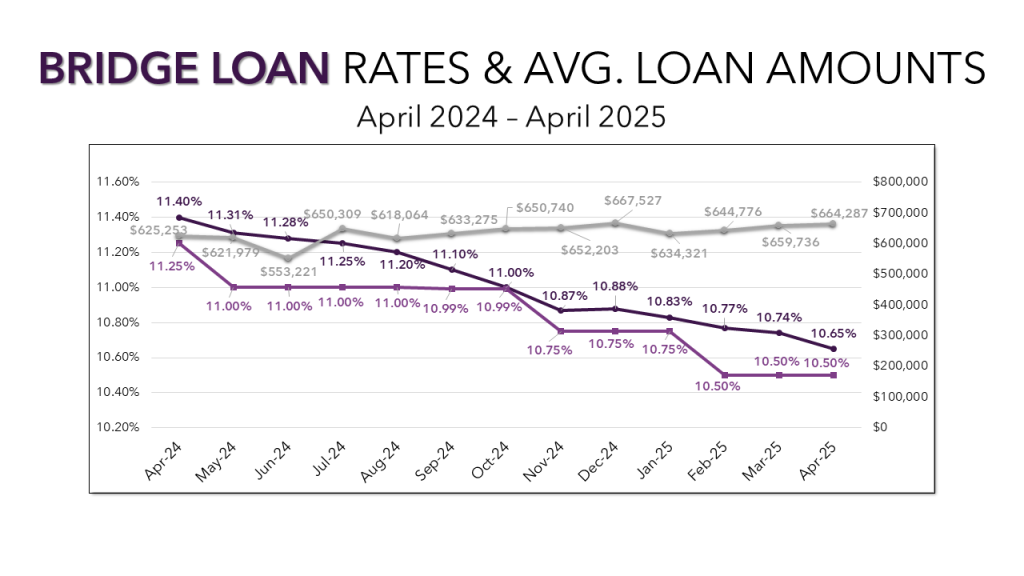
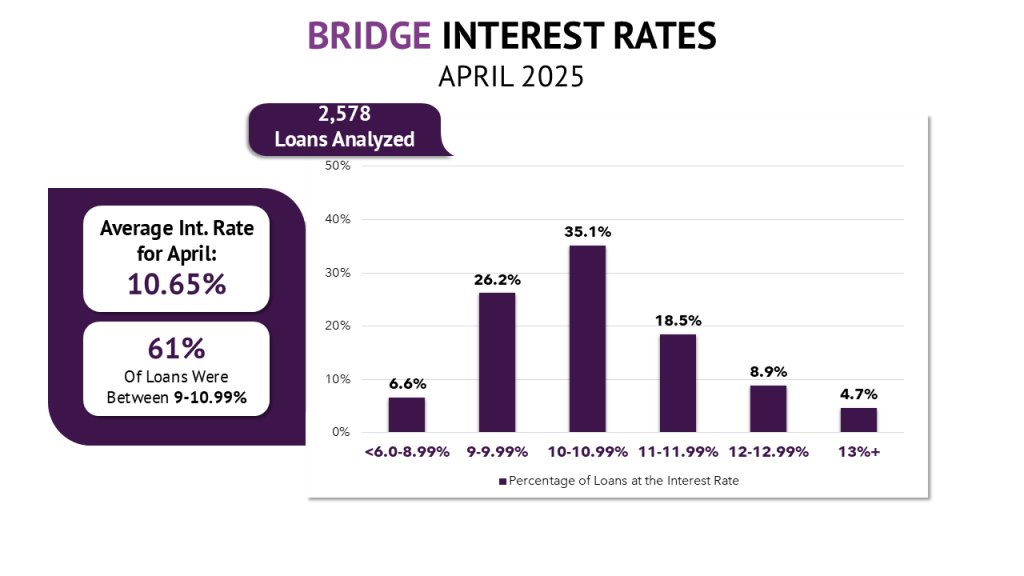
National bridge loan interest rates dropped again in April from 10.74% to 10.65%. With 11 decreases over the last 12 months, bridge loan interest rates are now 85 basis points lower than this time last year. Median rates held steady at 10.50%, narrowing the gap with the average.
Rate distribution shows 35% of loans falling between 10.00% and 10.99%. A shift toward loans priced between 9.00% and 9.99% appears to be the driving factor in the overall decrease in averages. We’ll take a deeper dive into specific markets later, but one key factor is that the dominant bridge loan market, Los Angeles, saw its average interest rate drop by nearly 50 basis points in April.
On the other hand, average loan amounts ticked up. The average climbed to $664,287, the highest since December, while the median held at $350,000. This points to a healthy mix: while large deals are lifting the average, most lending remains focused on mid-range transactions.
DSCR Interest Rates and Average Loan Amounts
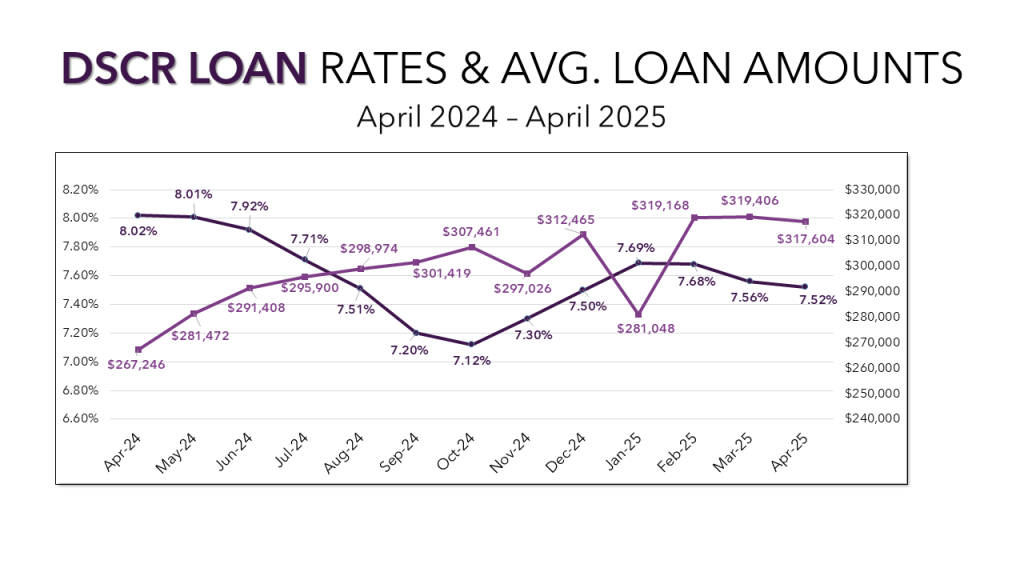
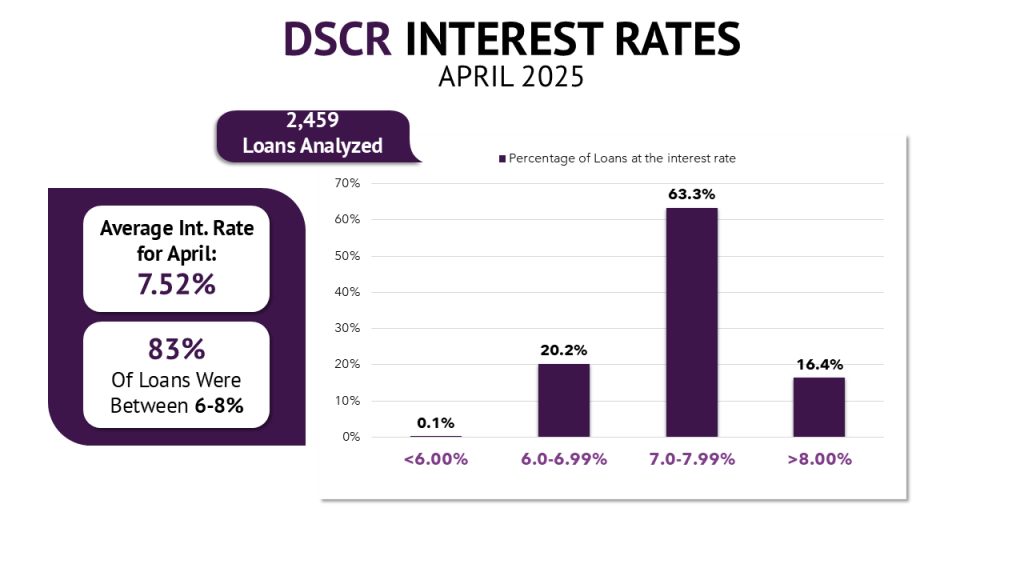
DSCR rates fell 4 basis points to 7.52%, the fourth consecutive month after a sharp increase during the closing months of 2024. Average loan amounts saw a slight dip to $317,604.
While over 63% of loans are still priced between 7.00% and 7.99%, the data is showing a meaningful shift toward lower rates. Similar to bridge loans, April’s top market for DSCR loans, Philadelphia, saw average interest rates drop by 19 basis points.
Spreads
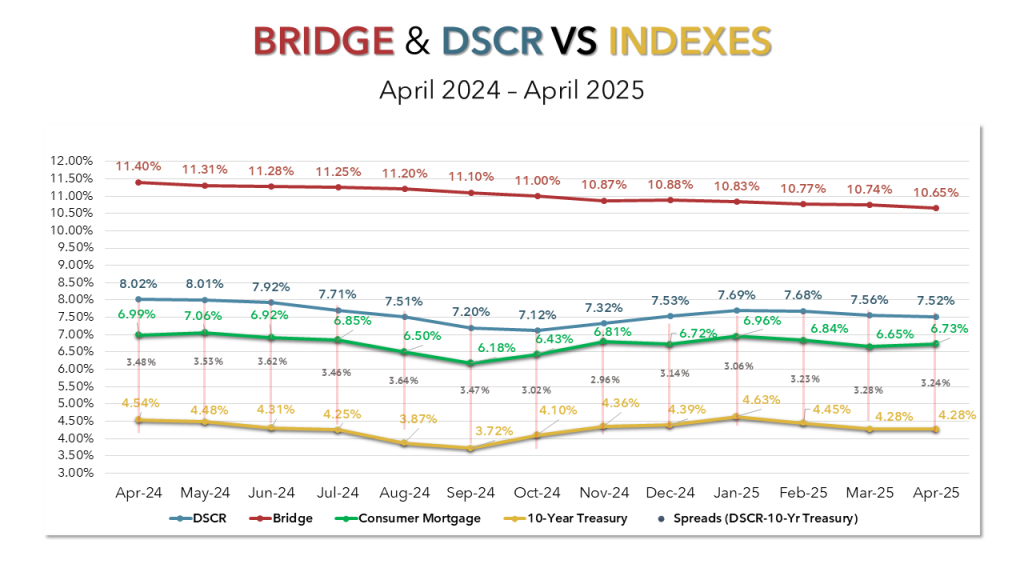
Despite a tumultuous month for federal economic policy, the 10-year treasury had no movement from March to April staying put at 4.28%. DSCR loans and consumer mortgages went in opposite directions with consumer mortgages increasing by 8 basis points, while DSCR rates dropped by 4. As a result, the spread between DSCR loans and the 10-year treasury tightened to 3.24%, signifying confidence in the market, although not as aggressive as Q4 2024 where spreads were much closer to 3%.
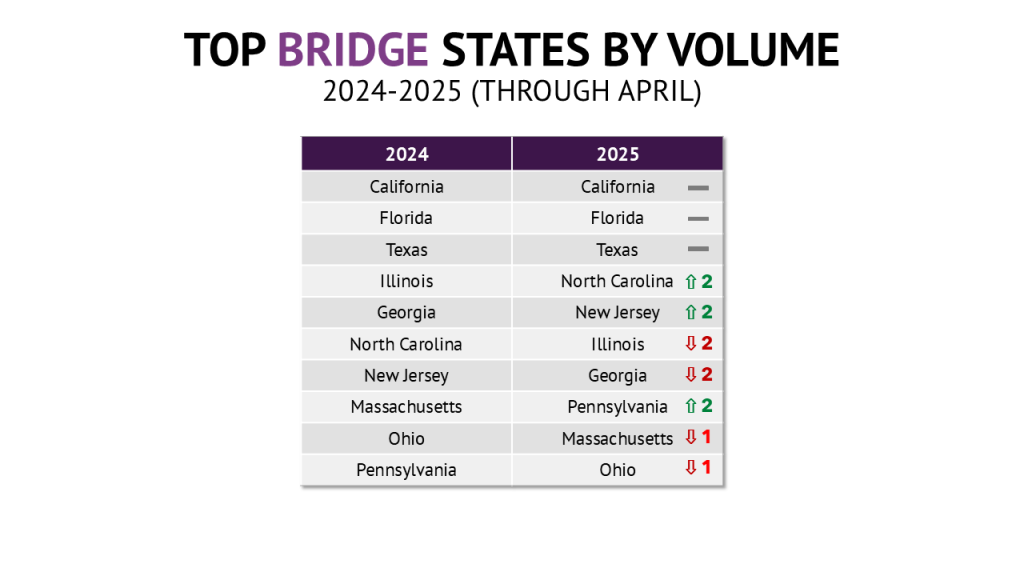
Top Bridge Loan States
One third of the way through the year and the top 10 states for bridge loans have remained consistent with 2024. California, Florida, and Texas still lead, while North Carolina, New Jersey, and Pennsylvania have climbed the ranks.
One factor worth noting: each of these states ranks among the top 11 by population. The one major outlier is New York, which continues to lag due to its challenging mortgage lending dynamics.
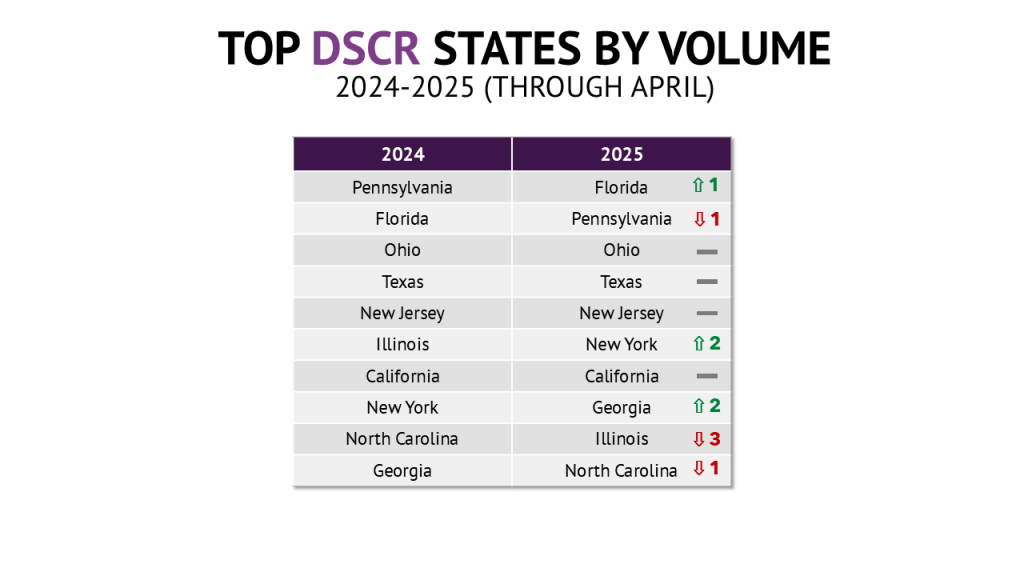
Top DSCR Loan States
The top 10 states for DSCR loans have also held steady since 2024. Florida leads so far in 2025, with New York and Georgia making gains. For lenders looking to expand into new markets, Washington and Massachusetts stand out as highly populated states where DSCR volume remains relatively low.
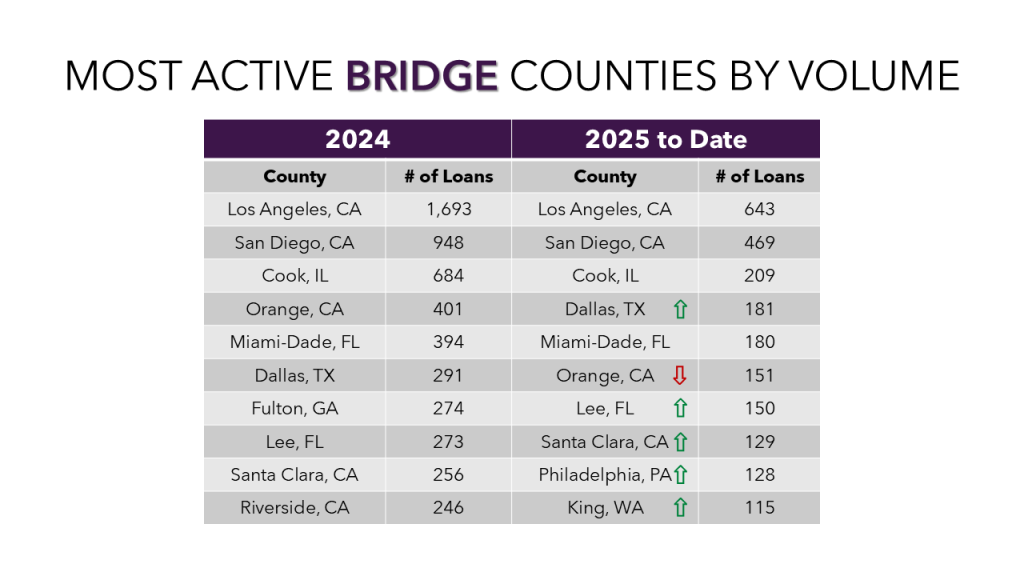
Bridge Counties
As the leading state for bridge loans, it’s no surprise that California dominates this list, claiming four of the top eight counties. Los Angeles remains the clear front-runner, with San Diego pulling ahead of the pack as well. Outside of California, Philadelphia and King County, WA (home to Seattle), are showing strong momentum.
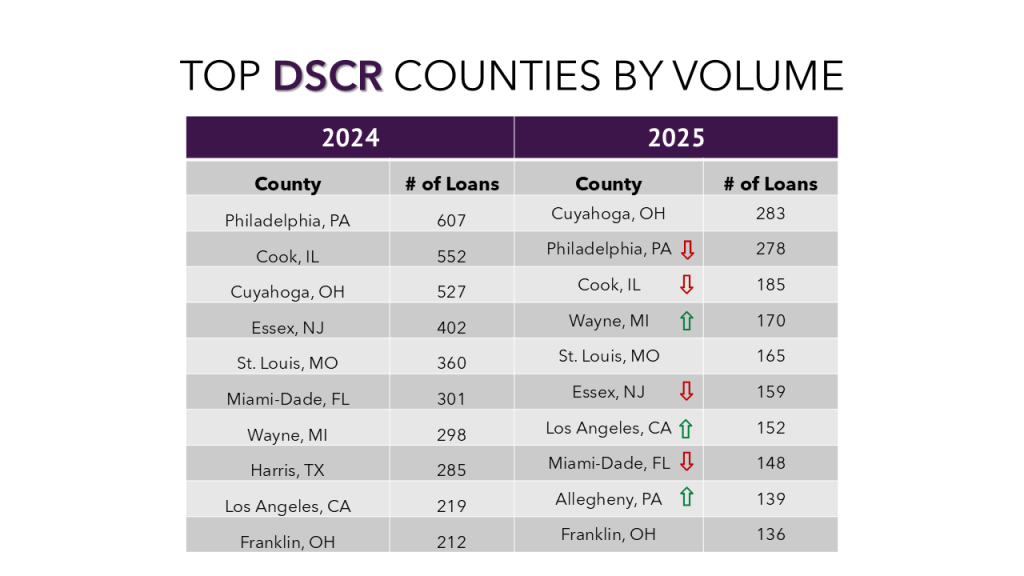
Top DSCR Counties
Cuyahoga and Philadelphia continue to trade places at the top, with Cuyahoga edging ahead in April. DSCR loan volume remains concentrated in the Midwest and Northeast, distinct from the more coastal-heavy bridge loan markets.
Parting Thoughts
Lenders who have built their businesses around automation, efficiency, and delivering competitive terms continue to scale, regardless of what the macroeconomic environment throws their way. April brought a wave of uncertainty with sudden tariff announcements and sharp moves in the bond market, but private lenders using Lightning Docs pushed forward, setting new records for both bridge and DSCR loans on the platform.
While tariff policy remains fluid and the federal economic outlook uncertain, one thing is clear: lenders equipped with the right tools are better positioned to adapt and grow. As we look ahead, agility and data-driven decision-making will continue to separate the leaders from the rest of the market.